IAP Climate: Sonia Seliger (’26)
This IAP, I worked with the MIT Office of Sustainability through the PKG Center IAP Climate program. Our team’s goal was to create a dashboard that visually presents data on extreme heat across MIT’s campus, helping the community better understand localized temperature variations and heat risks.
In the summer of 2024, ten sensors were installed in various locations across campus, collecting data from June to December. These sensors recorded temperature, relative humidity, and dew point every ten minutes. This local data is important because the temperature you see on a weather app – reported by the National Weather Service at Boston Logan Airport – doesn’t always match what people actually experience. Some areas, especially historically redlined neighborhoods, can be 10-15°F hotter than Logan’s reading, increasing the risk of heat-related health issues and infrastructure strain.
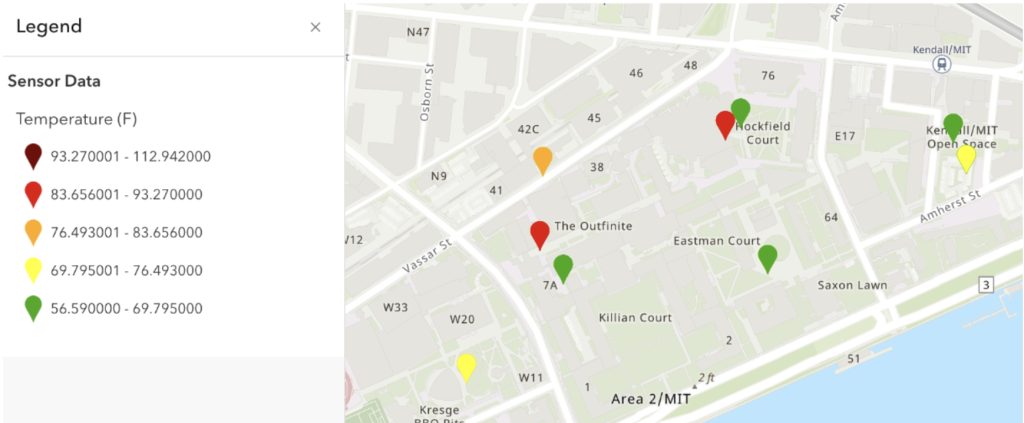
Our team’s job was to take this raw sensor data and design a dashboard that made it easy for the MIT community to access and understand. Each day, we processed data with Excel and SQL, analyzed trends, and used ArcGIS and Tableau to create visualizations of temperature differences across campus. We focused on making the dashboard both informative and user-friendly, adding features like time sliders to show temperature changes throughout the day and color coding to make variations stand out.
One key takeaway from our analysis was that even though MIT’s campus appears to have a single, uniform temperature in weather reports, there are big differences between locations. For example, large paved areas like the Outfinite and Vassar Street were noticeably hotter than shaded, grassy spots like Eastman Court (see image below). Understanding these patterns is important for heat mitigation efforts, such as increasing shaded areas and improving cooling infrastructure – areas that other IAP Climate cohorts and the cities of Boston and Cambridge have worked on.
So What?
My experience this IAP was highly valuable, both technically and personally. I gained hands-on experience with ArcGIS, a geospatial analysis tool that I had never used before. Learning to navigate the software and apply it to a real-world dataset enhanced my technical skills in data visualization and analysis.
Beyond the technical skills I gained, this experience also helped me grow personally. Working closely with my teammates, Sophia and Louisa, was a great learning experience: despite coming from different majors and backgrounds, our shared passion for sustainability brought us together. We divided tasks based on our strengths and interests while keeping clear communication to make sure everything came together smoothly. Presenting our findings to supervisors and peers also pushed me to get better at explaining complex ideas and data in a way that anyone could understand.
Through this project, I also became much more aware of how extreme heat disproportionately affects low-income communities and communities of color. Heat exposure isn’t just uncomfortable – it is a serious public health crisis. Many vulnerable populations lack access to cooling infrastructure, putting them at higher risk of heat-related illnesses. By making local surface temperature data available, our project can help inform urban planning and policy decisions to better address these disparities.
Now What?
This experience reinforced my passion for sustainability and energy policy, especially in using data-driven insights to create more equitable climate solutions. Moving forward, I want to continue working on projects that connect technology and policy to address environmental challenges. I also gained a deeper appreciation for how complex climate resilience issues are. While tools like our dashboard are useful, they are just one piece of the solution. Addressing extreme heat requires a mix of policy changes, infrastructure improvements, and community engagement. Cities like Boston and Cambridge, and institutions like MIT, need to prioritize cooling strategies in historically underserved and key areas, whether through planting more trees, using reflective materials, or expanding access to cooling centers.
The success of projects like this really depends on bringing together experts from different fields, such as sustainability, urban planning, public health, and data science. This experience strengthened my commitment to working in the field of sustainability, and I am excited to keep applying what I have learned this January in my future studies and career.
